|
User Guide |
|
|
User Guide |
|
|
|
Drawing Properties« Lines and Rectangles | UserGuide | Polygons » Page Contents (hide) The canvas stores the drawing context or drawing properties — color, font, line style, etc. — that are used when drawing shapes and text. For example, when you first start drawing on a canvas, all shapes are drawn in black outline form. The drawing properties are used for all shapes and text until they are changed. In this section, we explore the drawing properties used with geometric shapes and the canvas methods used to change them. The drawing properties used to draw text on the canvas will be covered in a later section. Specifying ColorsColors are used for shapes, text and the canvas background. There are different ways to specify color for use in computer applications. One of the most common is with the use of the discrete RGB color space, in which the individual colors are specified by three intensity values or components within the range [0…255]. The three values correspond to the amount of light from the three primary colors — red, green, and blue — that must be added or mixed to produce a given color. An intensity value of 0 indicates no light while a value of 255 indicates full intensity. Thus, when all three values are 0, the result is black and when all three values are 255, the result is white. Colors of different hues and shades are produced by varying the three intensity values. For example, if we add equal proportions of red and green light, the result is yellow
The intensity of the yellow, however, depends on the intensity level of the red and green light
The RGB values needed to create some of the more common colors, out of a possible 16.7+ million, are shown in the tables below.
canvas.setBackground(red, green, blue) In the following code segment, we call the setBackground() method and pass it the appropriate RGB values for the new color, the result of which is shown to the right.
canvas.setBackground(name) For example, we can change the background color of the canvas to light green using the method call canvas.setBackground("light green") without having to know the actual RGB values necessary to produce the color. Color PropertiesWhen you first start drawing on a canvas, the geometric shapes are drawn in outline form with black lines 
But a geometric shape can also be filled with a color 
When a geometric shape is drawn on the canvas, the colors used to draw the shape are based on two drawing properties: the outline color and the fill color. Outline ColorTo set the outline color used to draw new shapes call one of the setOutline() canvas methods canvas.setOutline(red, green, blue) canvas.setOutline(name) For example, the method call canvas.setOutline("red") sets the outline color to red. If we draw a shape after setting the outline color, canvas.drawRectangle(10, 20, 100, 50) it will be drawn with a red outline 
Fill ColorTo draw a shape that is filled, you must first set the fill color using one of the setFill() methods canvas.setFill(red, green, blue) canvas.setFill(name) For example, the method call canvas.setFill("yellow") sets the fill color to yellow. If we draw a shape on the canvas after setting the fill color canvas.drawRectangle(10, 20, 100, 50) it will be drawn with the inside filled in yellow 
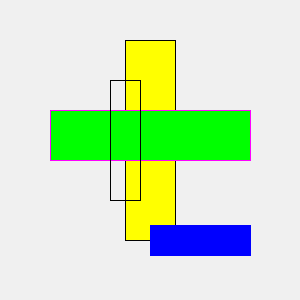
Sometimes, you may want to draw a shape that is filled and outlined in the same color. For convenience, both properties can be set to the same color using one of the setColor() methods canvas.setColor(red, green, blue) canvas.setColor(name) For example, the following code segment canvas.setColor("green") canvas.drawRectangle(0, 0, 100, 50) produces a rectangle that is both filled and outlined in green 
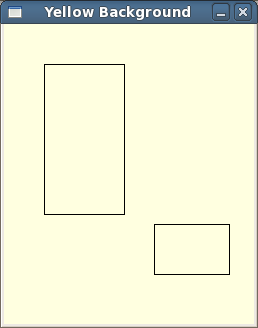
Transparent ShapesOnce set, the fill color will be used when drawing new shapes on the canvas. But what if you want to draw a new transparent or unfilled shape that is only outlined? The fill color has to be cleared, leaving only the outline color. This is done by calling the setFill() method with no arguments canvas.setFill() This is necessary when drawing multiple shapes where some are filled and others are only outlined, especially if the shapes overlap. For example, consider the following code segment which draws several overlapping rectangles
Line PropertiesThe style and size of lines drawn on the canvas are based on the current settings of two drawing properties: line style and line width. These properties affect not only line segments and arrows, but also the outlines of the various geometric shapes. Line WidthThe width of a line can be changed from the default of 1 pixel to any positive integer size using the setLineWidth() canvas method canvas.setLineWidth(size) The new width is used for all new shapes drawn on the canvas until changed with another call to the method. For example, we can change the line width to draw two rectangles with different outline sizes canvas.setLineWidth(2) canvas.drawRectangle(40, 25, 100, 50) canvas.setLineWidth(4) canvas.drawRectangle(150, 0, 50, 100) which produces 
Line StyleEzGraphics currently supports two line styles: solid and dashed. To change the style used to draw new lines on the canvas, use the setLineStyle() canvas method canvas.setLineStyle(style) in which the new style is indicated as a string. For example, to draw a dashed outlined rectangle, we can change to the dashed style before drawing the shape canvas.setLineStyle("dashed") canvas.drawRectangle(40, 30, 100, 50) which produces 
To reset the line style back to the default solid style, you pass canvas.setLineStyle("solid") Sample ProgramThe following program is a modified version of the earlier 
Program: barchart2.py
## barchar2.py # -- Draws a colored bar chart with horizontal and vertical axes. from ezgraphics import GraphicsWindow # Create the graphics window. win = GraphicsWindow(500, 300) win.setTitle("Simple Bar Chart") canvas = win.canvas() # Draw several filled bars of varying colors. canvas.setColor("red") canvas.drawRectangle(30, 240, 100, 20) canvas.setColor("blue") canvas.drawRectangle(30, 210, 160, 20) canvas.setColor("green") canvas.drawRectangle(30, 180, 200, 20) canvas.setColor("cyan") canvas.drawRectangle(30, 150, 90, 20) canvas.setColor("magenta") canvas.drawRectangle(30, 120, 50, 20) # Draw the axes with tick marks. canvas.setColor("black") canvas.setLineWidth(2) canvas.drawLine(30, 270, 30, 90) canvas.drawArrow(30, 270, 470, 270) canvas.setLineWidth(1) xOffset = 70 for i in range(10) : canvas.drawLine(xOffset, 268, xOffset, 273) xOffset = xOffset + 40 # Wait for the user to close the window. win.wait()
|
|||||||||||||||||||||||||||||||||||||||||||||||||||||||||||||||||||||||||||||||||||||||||||||||||||
|
Last modified: August 20, 2013, at 01:02 PM.
|