|
User Guide |
|

|
Ovals and Circles« Polygons | UserGuide | Text » Page Contents (hide) In the previous sections, you saw how to draw lines and polygons. But EzGraphics also supports the drawing of ovals and arcs. OvalsAn oval is defined by its bounding box. That is, you specify the size and position of a rectangle and the oval will be drawn inside and touching the edges of the bounding box. 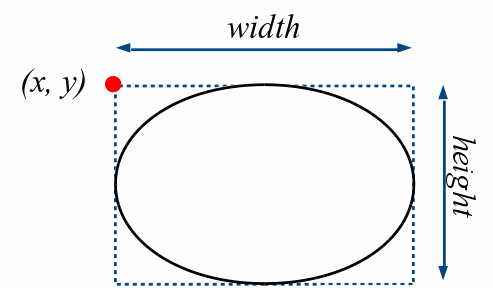
To draw an oval, use the drawOval() canvas method canvas.drawOval(x, y, width, height) For example, the command canvas.drawOval(10, 10, 200, 100) draws an oval that is 200 pixels wide and 100 pixels high with the upper-left corner of the bounding box at position (10, 10). 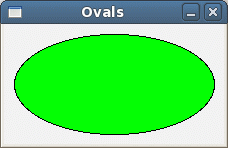
As with other geometric shapes, the color and style of the oval depends on the current drawing properties set for the canvas. Here, the fill color was green and the outline color was black. To draw a circle, simply set the width and height of the bounding box to the same values canvas.drawOval(60, 10, 100, 100) The result of this command is shown below 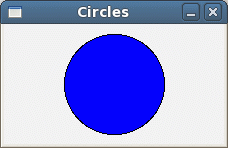
Arcs and Pie SlicesYou can also draw an arc or slice of a circle like those used in pie charts 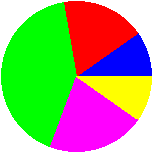
An arc is first defined by the position and size of the circle from which the slice is made, similar to that of an oval. 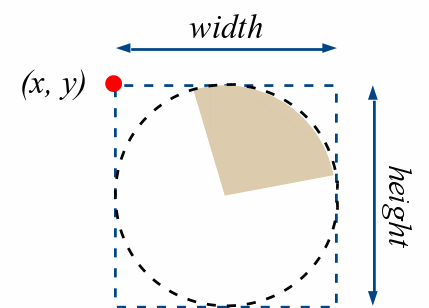
In addition, you must specify the point about the circumference of the circle in a counter-clockwise direction at which the slice begins and the size of the slice. Both values are specified as angles in degrees. 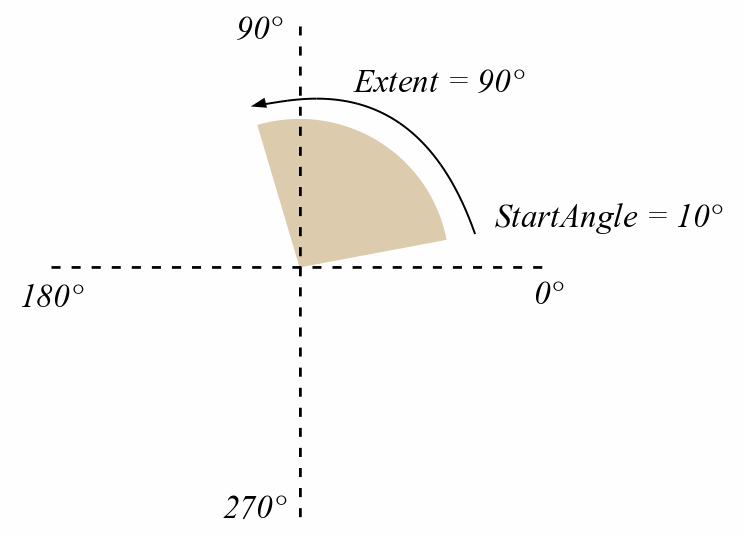
The starting angle is the angle about the center of the circle as measured from the positive x-axis to the beginning of the slice. The extent is the angle as measured from the starting angle to the end of the slice. For example, suppose you want to specify the slice shown below 
which has a size of one-eight of the circle and positioned such that it ends at the negative x-axis. Then the starting angle would be 135° and the extent would be 45°. 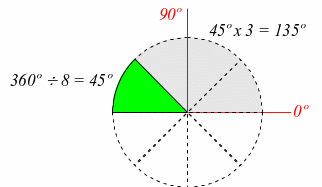
To draw an arc, use the drawArc() canvas method canvas.drawArc(x, y, diameter, startAngle, extent) For example, the command canvas.drawArc(10, 10, 100, 0, 180) draws the top half of a circle that has a 100 pixel diameter and is positioned with the upper-left corner of its bounding box at (10, 10). 
while the command canvas.drawArc(10, 10, 100, 135, 45) draws the pie slice that is one-eight of the circle described earlier. For a more complete example, consider the following code segment that draws the pie chart shown at the beginning of the section XPOS = 25 YPOS = 40 SIZE = 150 canvas.setColor("blue") canvas.drawArc(XPOS, YPOS, SIZE, 0, 35) canvas.setColor("red") canvas.drawArc(XPOS, YPOS, SIZE, 35, 65) canvas.setColor("green") canvas.drawArc(XPOS, YPOS, SIZE, 100, 150) canvas.setColor("magenta") canvas.drawArc(XPOS, YPOS, SIZE, 250, 75) canvas.setColor("yellow") canvas.drawArc(XPOS, YPOS, SIZE, 325, 35) Sample ProgramThe following program creates a target with a bulls eye using concentric circles of alternating colors. bullseye.py
|
|
Last modified: August 22, 2013, at 09:02 AM.
|